data310
Graphs with inverse transformed/unscaled data
loss plot

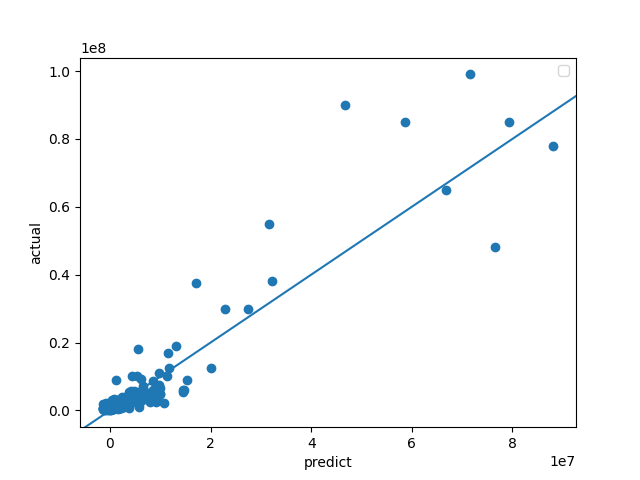
actual vs. predicted price

number 2
histogram of actual house prices

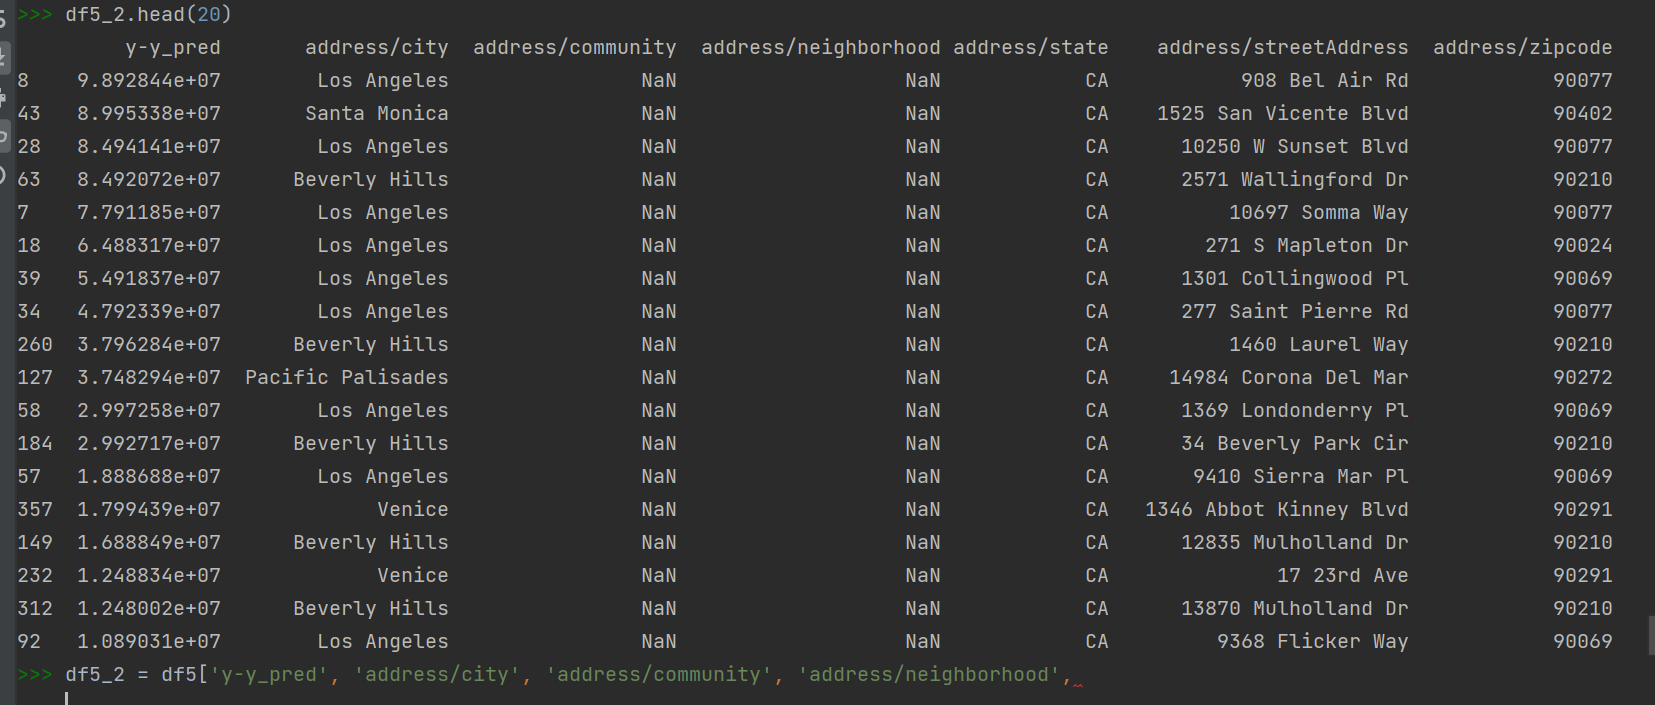
spatial variable

number 3
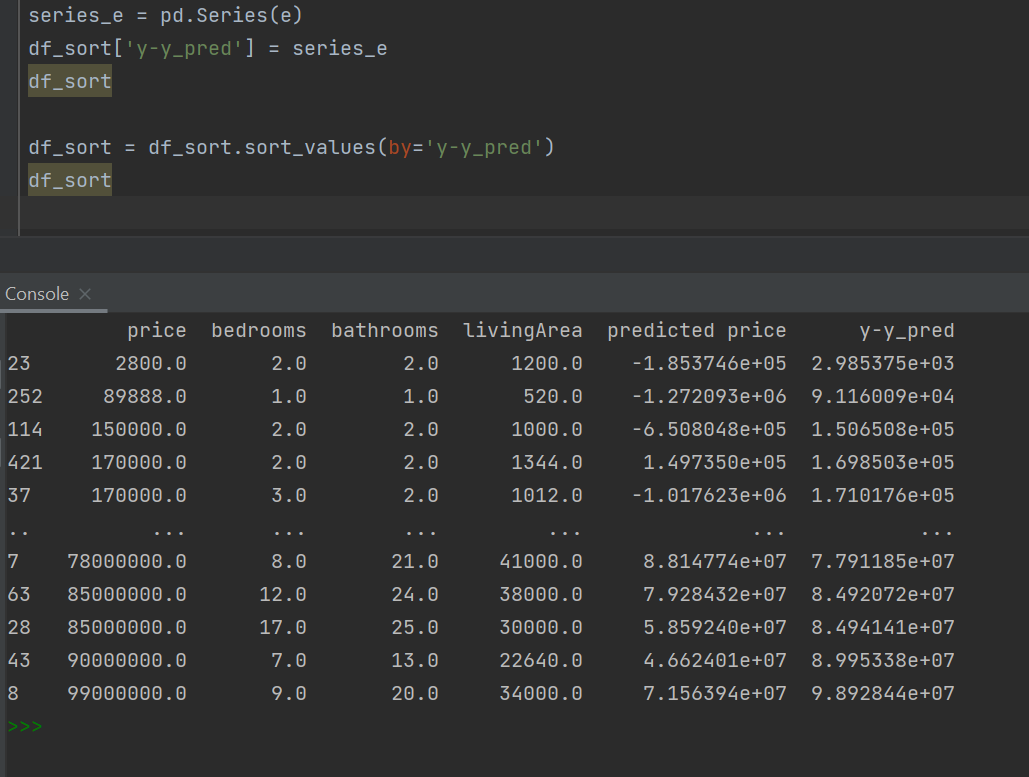
sorted ascending y-y_pred

number 4
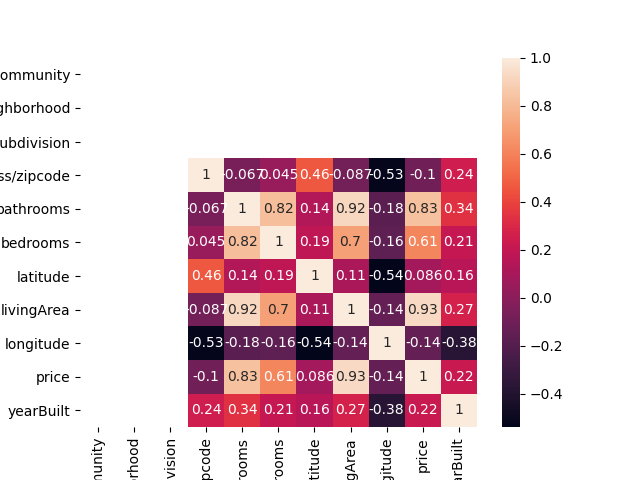
heatmap/correlation coefficients

Graphs with inverse transformed/unscaled data
loss plot

actual vs. predicted price

number 2
histogram of actual house prices

spatial variable

number 3
sorted ascending y-y_pred

number 4
heatmap/correlation coefficients
